

July 20, 2013
July 18, 2013
Weekly update 7/18
After this mornings squeeze above all time highs I am quite comfortable entering short positions on a daily, weekly and monthly time frame.
We now have reports out from the strongest companies as well as infinity + 1 speeches from the Bernank. What else is there really?
We also have neutralisation of overly bearish sentiment as is witnessed in the AAII sentiment survey as well as put/call ratios and data from individual broker firms.
Hedged positions can consist of:
Long SPX, short tech in general or weak companies like BBRY, NOK, LOGI, AAPL, LXK, HPQ. Remember that the market boat has lifted these as well over the last months.
Long SPX, short commodities.
Long Germany, short PIGS.
Basically these are the themes that I have held as a base all year.
July 16, 2013
Weekly update 7/16
Ok, so right now with the snp at 1674 we are at the one day pullback as outlined earlier. Expect aths and then there is potential for the larger correction/ consolidation phase.
July 10, 2013
Weekly update 7/10
SPX at 1652. A lot of intraday hedging going on for me today since market behaviour favour that the last breath run could continue another week or maximum two as outlined in previous post. I am daytrading in this environment, paying respect to the upward momentum and waiting for that to wane. Probably we will see a one day pullback met by some buying and then a failure with the following movement. Stay patient and know that the next big move is down.
July 9, 2013
weekly update 7/9
Sticking to plan in previous post and staying short here. Both equities and broad based commodities basket. Very strong "short" focus by also being long the dollar vs various other currencies. Sure it is possible we will see the squeeze continuing one more week but up here it is not worth chasing even if the last points in a bull run squeeze like this is very "easy" money for the correctly positioned traders. With easy, I mean that it is usually a low volume, quick increase in asset prices, compared to the more long term fundamentally anchored increase that is more choppy.
July 1, 2013
weekly update 7/1
My last post was one of a cautionary stance. I am keeping my exposure low still with this chop-chop going on. But I am seeing signs of a continuation to the downside in most risky assets starting within a week or two from now. As correlations are all over the map right now, with the dollar, commodities, gold and equities swithings signs from day to day, I am still keeping my size small and scaling in to bearish positions both in time and price, for the moment, increasing only on rips.
In 1-2 weeks or when S&P hits 1630-1635, whatever comes first, I will be fully short.
In 1-2 weeks or when S&P hits 1630-1635, whatever comes first, I will be fully short.
June 18, 2013
Weekly update 18/6
Buying in to OPEX once again proved a profitable strategy. I am not taking any chances with the central planners day and will exit most positions and actually start scaling in to more bearish positioning again. It seems most commodities again are breaking down and interestingly enough crude oil has held up, that could be something catching up on the downside once the upward momentum wears off.
Looking for a consolidating summer with current levels being the higher area of that range.
Looking for a consolidating summer with current levels being the higher area of that range.
June 5, 2013
May 19, 2013
Weekly update 5/19
SPX @ 1666, "Long time no update" and "From the devil to the Bernank"
1000 points. Pretty amazing! Obviously the strategy outlined in the last post was for a top to be created around 1580-1600. Sentiment and other technicals suggested in the beginning of May as we rose above previous highs and still bears stayed committed to their negative positioning that we would continue to pain trade upwards. I have stayed mostly short commodities and long equities, trying not to get net short. Obviously my calls on gold and silver have paid off well.
Same indicators suggest still that the pain trade is upwards even if some of that "bearish upward pressure" has been alleviated during the last week of opex squeeze. Friday afternoon it was especially visibile when DAX all of a sudden jumped 50 points, obviously a short squeeze. Looking at more extreme assets like Greek equities shows a parabolic development indicating extensive short covering. This suggests bears are beginning to capitulate. I am not suggesting there are even that many bears but on the margin given these central bank injections, it does not take a lot of bearish hedging to give the market this kind of bernanke put that just gives it this continous upward drift.
Now, we are at a point where technicals in terms of mean reversion potential etc is extreme out of a historical perspective. If we can only get some bear capitulation, we can begin a consolidation and downward drift period.
I would decrease position size and look at this from a longer than usual perspective, say a couple of months instead of couple of weeks, and for that period I see a high conviction of lower prices.
One simple and really disturbing fact of the markets is that they are 90% politically and central bank driven. Naturally that news flow decreases during the summer when they go on vacation. It is also the time when people in the northern hemisphere tend to group and protest against the measures that the same ruling guys/troika imposes on them. So that simple fact could actually contribute to a very real new normal seasonal effect (New Normal.X11?) where markets correct during the summer (on central planners vacation) and rise during the rest of the year.
Begin with long/short on strong vs weak markets (weak markets that have squeezed lately) Increase bearish positioning during the next 4 week period if subscribing to this game plan, but with a smaller than usual size.
April 23, 2013
Weekly update 4/23
The coming opportunity to once again sell the market at 1580-1610 is a gift. Holding long short positions in equities vs commodities has been profitable. Will look for shorts in fundamentally weak markets that has short squeezed lately, like spain and italy, together with shorts in commodities. Continously, on/off, after the market has corrected some, hedging is done with a strong market like the s&p.
April 15, 2013
Weekly update 4/15
Have a look at the previous recommendations and my charts.
I would not continue to aggressively sell commodities here.
In the S&P I would be looking for a consolidation move sideways in before mentioned intervals this week and perhaps next and then higher again if the bearish hedging continues at this pace.
Will evaluate the relative value of commodities vs equities as this consolidation period continues.
As always, sell volatility on any spikes.
April 3, 2013
Weekly update 4/3
SPX @ 1561. So, in my last two posts I called for
1) Obviously we seem to be needing new all time highs in SPX and DAX to finally flush out the last of the bearish speculators. I do not expect much follow through and will follow the scenario outlined in the last post with a trading range between 1540 and 1570.
2) Sentiment, technicals and fundamentals now warrant a decline below 1540, maybe all the way to 1500-1510 in to earnings season.
Both these statements I actually hold on to still. I am short puts and calls around this strategy. Tomorrow is ECB day and there is a tradable chance (i.e. market is underestimating the chances of a rate cut IMO), that ECB lowers the rate or signals strongly for lower rates. That would create a huge spike since short interest has risen the last few days near the all time highs in the SPX. Without that ECB fuel, I expect us to visit 1510 without much of a pause within the next 1-2 weeks. A second trigger could be the payrolls report friday. So within that event setup lies the trading strategy.
I would hold onto the statement selling around 1570-1575, expecting we do visit the region around 1510 into earnings season. THAT would provide fuel for another leg higher but that is also a leg I would sell in to... altough at slightly higher levels, lets say even above 1600 if we are lucky.
That is my road map at the moment. Obviously any long equity exposures are hedged partly or completely by short commodities as pointed out previously and in the yearly strategy update.
March 21, 2013
Weekly update
SPX @ 1548. Sentiment, technicals and fundamentals now warrant a decline below 1540, maybe all the way to 1500-1510 in to earnings season. But then there could also be a silly Cyprus is saved effect, but then also I believe many people are positioning themselves for exactly that so complacency favours the downside to 1500-1510.
March 15, 2013
ATH
SPX @ 1560.
Obviously we seem to be needing new all time highs in SPX and DAX to finally flush out the last of the bearish speculators. I do not expect much follow through and will follow the scenario outlined in the last post with a trading range between 1540 and 1570.
Obviously we seem to be needing new all time highs in SPX and DAX to finally flush out the last of the bearish speculators. I do not expect much follow through and will follow the scenario outlined in the last post with a trading range between 1540 and 1570.
March 8, 2013
Strategy update
SPX @ 1550.
So, we have come a long way in a short period of time. SPX at close to all time highs, indices everywhere on multi year highs. And people are still very bearish. That is the force driving this market higher still, in a pattern that means far between corrections and that corrections, when they come, happen at the point bears capitulate strongly, like >+1% days. I am starting to balance my portfolio from net long, to balanced (long equities balanced by short equity names mostly in the tech space as well as commodities).
I will also let myself be short some indices, mainly southern europe, going in to march and april. Below I offer a daily 1 year view and weekly 20 year view of SPX. First, I believe we will make some swings around these levels, to frustrate the hell out of bears who will pile on shorts on any decline and then run for cover on new highs, as well as new high buyers that will be whipsawed out of the market... in numbers lets aim for 10-30 point swings in SPX with a slight upward bias, moving in interval 1540-1570.
Intermediate term ~3 months, I would say it makes sense to look for sideways, if not lower prices from around these levels.
Choose your aggressiveness, long/short according to earlier strategies, equities/commodities or go outright short, depending on your risk level. You can also choose to go long SPX vs short NDX or long SPX vs short european indices etc.


February 28, 2013
Chart update
WTI, Light Crude Oil, Update, note real time quote @ 92

Silver

Gold

SPX - looking for a blow off top between 1530 and 1550, then some sideways/down action until we build a base.


Silver

Gold

SPX - looking for a blow off top between 1530 and 1550, then some sideways/down action until we build a base.

February 22, 2013
Weekly update
SPX @ 1512. The crowd turned awfully bearish after just one day of declines. I used the decline to sell vol and increase longs on equities while slightly decreasing shorts in the commodity space. Also keeping a bunch of shorts in weak equity names. The consensus is now very much to buy the dip and see new all time highs. My playbook says that we first at least will get a fake new high of the year in early march and then we could be in for some sort of wider consolidation period until things become more clear. At that point I would aggressively short commodities and almost as aggressively short some equities and on third place broader equity indices. So, first higher, but less than the crowd consensus will be, and then down, through the buy the dip camp levels. Perfect for fooling as many as possible.
February 18, 2013

February 14, 2013
Weekly update 2/14
SPX at 1521. OPEX tomorrow. Expecting very small movements until end of next week when indices will break upwards and continue to slow motion squeeeezeee...
Nice to see precious metals breaking down. This could get ugly on the downside with everybody and their granny long.

Nice to see precious metals breaking down. This could get ugly on the downside with everybody and their granny long.

February 8, 2013
Weekly update 2/8
SPX at 1517. The only update I will give is a first estimate of when it makes sense to start selling in to this rally. Until then, just ride the rally and sell option vol on any uptick in vol. That the equity market will continue its grind higher is the high conviction low risk trade, what will be more interesting is to see if metals will disconnect from the equity market in this rotation phase. There will be more money to be made in that space than the equity space if that is the case.
The first estimate of when to start selling is mid march. That is when according to my analysis of sentiment, fundamentals and other technicals, we will have a first window opportunity of taking advantage of a potentially neutralized bearish sentiment which can give way for some real profit taking. Until then, stay long.
The first estimate of when to start selling is mid march. That is when according to my analysis of sentiment, fundamentals and other technicals, we will have a first window opportunity of taking advantage of a potentially neutralized bearish sentiment which can give way for some real profit taking. Until then, stay long.
February 3, 2013
Weekly Update 2/3
SPX at 1513. Everybody are trying to call the top. This market will continue to grind higher in the following week, with perhaps, a small shakeout of new weak longs that will once again have us testing 1490-1505 area. But more likely than nominal levels, this is about relative levels, i.e. a 1% decline from high to low in a market that has around 3-5% more upside before the possibility of a larger correction, i.e. MA 20, MA 50 correction.
Continuing to sell equity volatility on any increase in premiums is a very profitable strategy in this environment, as long as premium does not reflect the fact that markets will be dead (prices set by central banks) for some time still. After a 1-2% decline I would be selling atm puts.
I still prefer selling the commodity spectrum (especially precious metals) on any upticks, and especially when we are close to "risk market highs", which we are at the moment. Then the long equities, short commodity trade makes a lot of sense to increase in position size. Also to take advantage of the super short squeeze we have seen in some fundamentally very weak names like RIMM/BBY, NOK, AMD, LXK, XRX, PHILIPS, FB, LOGI. Short these against long positions in the likes of GOOG, IBM, GE, MCD, PG etc...
January 31, 2013
Weekly update 1/30
With the SPX down to 1498 from 1511, that could actually be it when it comes to downside for now.
January 29, 2013
Weekly update 1/29
SPX at 1508. Look for a short term top in relation to the FED-meeting. I am completely hedged now with beta adjusted 0% net long positions (hedged long and short equity positions as well as equities vs commodities). Looking to gradually increase net short in the coming 3 days both in time and space (index level 1410-1415). This is not for more than 10-20 handles downside target. Also not sure how much higher we can go before a larger downturn as well. Not willing to risk net long at these levels and above.
My strategy will still be to sell volatility on any day spike and collect some premium. Writing covered calls is an excellent strategy in this environment where the market is stretched to the upside but still has limited downside. I would also write some puts as we go down 10-20 handels to best take full advantage of the consolidation phase.
My strategy will still be to sell volatility on any day spike and collect some premium. Writing covered calls is an excellent strategy in this environment where the market is stretched to the upside but still has limited downside. I would also write some puts as we go down 10-20 handels to best take full advantage of the consolidation phase.
January 25, 2013
Chart update 1/25
S&P now at 1502. A lot of people have jumped on the bandwagon the last week. Earnings and Revenues are not super great but they are there and equities are valued at around p/e 15 on this years earnings. Apple is yielding more than 10Y US Treasuries. I am not saying 10Y US Treasuries would be where they are without the FED's actions but still, there are bullish cases to be made and as long as that is the case, the bullish bandwagon is to be respected.
Considering the rapid rise and many days without correction I think the market will frustrate the hell out of both bulls and bears in the coming weeks, a trendless low volatility market say 1490-1510. Then we will see some final push in to 1520-1530 where the situation will need to be reevaluated but for now I am comfortable shorting equities there and being long short individual equity names as well as long short equity index vs commodities on the way up there. Most likely we will have a trendless market up there for some months.
What is more interesting and potentially trending is the commodity space. Gold could be breaking down hard and to a lesser degree copper. I believe there are two drivers behind this move now, 1) the beginning of the first period end of money printing (i.e. there will be more later on). 2) the great asset class rotation from interest bearing assets to income generating assets.


January 23, 2013
Apple earnings
I have been negative towards the iPhone 5 and lack of new ideas after Steve Jobs death, but at 445 AAPL is a screaming buy no matter the obstacles. I believe the shares will continue to trade violently in something like a 100$ range until all weak hands have been shaken out. Longer term the company will face pressure from competitors but short term, valuation and still a strong product mix will help the shares.
Weekly update 1/23
I am once again establishing short positions in precious metals. It seems a lot of the central bank news, including BOJ has been discounted in the short term and I belive we will have a nontrending/declining picture for the precious metals this year so I will be shorting on rallies.
This also rhymes with generally excessive hedges in the risky markets which means any short positions in the equity markets will have to wait until these hedges have been neutralized.
This also rhymes with generally excessive hedges in the risky markets which means any short positions in the equity markets will have to wait until these hedges have been neutralized.
January 17, 2013
Weekly update 1/17
January OPEX tomorrow and the S&P at 1484. Looking back at the previous post I would actually ride this rally a bit further considering the latest central bank news, the more nuanced FED ending QE-talk, the overall decent earnings and general (still) tendency to very quickly take profits, hedge, be under weighted, whatever.
I think my strongest calls on 1) low volatility / sell volatility on spikes, and 2) short commodities vs equities, still are the place to be. Looking at individual equity names there has been huge rallies in the most shorted stocks lately. They are mostly still awful businesses so the upcoming short opportunity will not be in the major indexes but in individual names. I am preparing a basket of shorts against the market to be entered gradually as the market will be topping out/drifting sideways during the period starting february and forward. I will then also try a short basket of commodities against equities, although the hedge will not be 1:1 since I also believe there will be a decline in equities in absolute terms but not in relative terms.
I think my strongest calls on 1) low volatility / sell volatility on spikes, and 2) short commodities vs equities, still are the place to be. Looking at individual equity names there has been huge rallies in the most shorted stocks lately. They are mostly still awful businesses so the upcoming short opportunity will not be in the major indexes but in individual names. I am preparing a basket of shorts against the market to be entered gradually as the market will be topping out/drifting sideways during the period starting february and forward. I will then also try a short basket of commodities against equities, although the hedge will not be 1:1 since I also believe there will be a decline in equities in absolute terms but not in relative terms.
January 3, 2013
Weekly update 1/3
Woha, debt ceiling relief with a boost! So what is the reaction to the action?
1) Debt ceiling relief. Short term, sell voll and await a further squeeze to 1480-1500. There it's time to be net short again. Seems like we will have a strong NFP report tomorrow and maybe finish the squeeze into january opex.
2) The Feds announcement of ending QE 2013! This is huge. My calls on buying USD, selling commodities including gold was valid even without this announcement. Now these strategy calls seems like the best bets for the year. Sell everything commodity and small cap like and buy large cap and relatively safer assets. Don't confuse end of QE with end of 0 short term interest rates. I believe that further along there will be requirements for more QE and then new buying opportunities in commodities. We are far from there right now though. The bullish retail speculators need to be flushed out.
December 31, 2012
Strategy update 2013
As mentioned in the previous post I was a seller in to the santa rally. Generally, I like to position myself by entering or exiting trades in two dimensions, both time and "space"/price. An example would be the last weeks where I have a view on selling in to a coming rally and therefore taking positions over a time of aprox two weeks, at regular intervals. Half my position is created that way and the other half by taking action on pre set index levels.
Even considering last few years of totally central bank and politics driven markets, this market right now is extremely event driven out of Washington. It is very likely we get a whipsaw movements depending on what happens in the next few days. I have a clear strategy how to play it and it rhymes with what I have advocated here many times last few years. Simplified it is:
Sell the rally and buy the dip.
That single statement is the most important to remember going forward as well and my strategy piece for 2013 would be titled exactly that. There simply is no real long term growth driver like previous 30 years and there simply is too much intervention in price levels for a large price decline.
More short termish, any excessive reaction to the fiscal cliff will be mean reversion traded. In the next few weeks, no matter the outcome, I think we will test around 1350 in the S&P. But that level will be bought by me. How to react to the following upswing to 1400-1430 again is another story.
For 2013 some of my themes that I will trade around will be:
Short base metals and crude oil against equities and gold (on a flush out of extreme bullishness in gold).
Short relative small cap tech companies against large global mega cap tech companies.
Long global mega cap companies.
Long USD vs SEK.
Long SPX vs OMX.
Sell volatility on any spike.
Happy new year!
December 3, 2012
Weekly update 12/3
I am a seller in to all rallies now. I would also, contrary to previous post, not hold longs in precious metals.

Very weak technicals here with negative divergences in weekly RSI translating in to long term weakness in prices.


Very weak technicals here with negative divergences in weekly RSI translating in to long term weakness in prices.

November 28, 2012
Weekly update 11/28
Looking to increase longs in to this weakness but it is not without hedging. There are many weak equity names out there and looking at the bigger macro picture, there are industrial metals and energy that are relatively weak and continue to be good hedges (something I have stressed for some months now) against equity longs. Precious metals continue to be good longs as well.
This could be the last upmove in equities before we get a bigger correction going (both in time and space). Emerging markets are horribly weak and also some developed markets like export oriented Sweden which also has not had its housing market crash yet (but it will), compared with for example the S&P. So there are many ways to setup long/short portfolios in this environment.
In many markets it is obvious that central bank actions are boosting financials relative to industrial. This I take as a sign as the final push higher, when fundamentals (layoffs) catch up, it will hurt everyone. But it is more - both in fundamental analys and technical analysis - a projection about generally "dead" markets than something that will crash like post 2000 and 2008.


November 25, 2012
Weekly update
Ok, so the projection from last week was to look for a brief flushout starting Monday. It will be very important to see how the emerging markets are behaving, considering the weak technical picture shown in the earlier post. With holiday volumes here in the west, it is easy to envision a slow pain trade grind with a positive bias simply because of the negative positioning and sentiment. But there is something potentially very weak out there which deserves to be taken very seriously. I would not trade with more than 50% of normal volume until there is more clarity. Are these markets ready to really break higher? I doubt so and would rather than participate in the upside, decrease longs the coming weeks and end up fully net short by the end of the year.
November 21, 2012
Weekly update 11/21
Election squeeze, and over done sell off and now right back at 1390. A lot of technical damage was done the last weeks. If the SPX looks bad, commodities like oil and copper and some tech names are outright horrible. The only factor that is worse than these charts is sentiment. Sentiment is so bearish it only takes a minor piece of good news, like a half hearted fiscal cliff solution, to push this market to around year highs.


I am looking for a brief decline post thanksgiving to flush out some of the swing bulls and then a continued bearish sentiment driven squeeze to around new highs. This position could easily be hedged by short positions in some commodities as well as a long position in the dollar. It looks like emerging markets will lead the way to the downside after this final squeeze. Right now, let the option premium decay in to the low volatility holiday season.
November 6, 2012
Weekly update 11/6
I would recommend using an election squeeze to light up on longs. Also, those sold puts are moving towards 0. I would not stress about hedging that position, rather selling some calls on the squeeze depending on how vol moves post elections. Selling calls and buying puts is the more aggressive trade. I believe we have a sideways consolidating market with a bias towards the downside as time progresses. Therefore selling vol strike november and buying vol strike december could be the best strategy.
I also recommend creating long short portfolios, shorting weak technology names and going long index. Oil and copper also looks like a good shorts on this squeeze.
I also recommend creating long short portfolios, shorting weak technology names and going long index. Oil and copper also looks like a good shorts on this squeeze.
October 31, 2012
Weekly update 10/31
After a week of wound licking I am ready for a new position in the market. With SPX at 1405 and projected range of 1400-1500 in to the new year, the area around 1400, especially given elevated vix, is excellent for selling atm puts. I am prepared for perhaps one final shakeout so I take half the position now and half on an event related move higher or on a shakeout between 1390 and 1400.

The vix is at 18.6 vs a realized SPX 20-day volatility ~10, which strengthens the case of selling option premium.
October 23, 2012
October 22, 2012
Weekly update 10/22
Continue to just buy the fucking dip and complement that with selling ATM nov/dec puts to take advantage of the relatively high option premiums at the moment. Let time do it's magic!
October 20, 2012
October 13, 2012
Weekly update 13/10
The slow grind consolidation phase has continued in time and levels a bit beyond my first estimation. At the same time China seems to be breaking out to the upside and outperforming, a much welcome development compared to basically the last two years. WHEN the market turns up again, with ok earnings as a catalyst, new highs will be in in less than half the time it took to consolidate down to these levels around 1430.
Relative strength and weakness studies show that it will continue to be a good investment strategy to be long SPX and short countries with strong currencies like SWEDEN. That can also be hedged by a long position in USDSEK.
Relative strength and weakness studies show that it will continue to be a good investment strategy to be long SPX and short countries with strong currencies like SWEDEN. That can also be hedged by a long position in USDSEK.
October 7, 2012
Weekly update 7/10
Someone recently asked me how I, as one in many ways quite bearish macro guy, can stay bullish on equities. I have pointed this out on several occations rcently but here I go again;
1) central banks
2) companies are the finest materia on earth, valuations, debt levels etc.
3) a generally bearish investment community
4) a lean business cycle without general excess production that would cause a traditional recession.
(1) is a long term play. We will obviously have tradable downturns of +5% even during this period of central bank activism. But probably not until either of (2), (3) or (4) turns negative. The first tradable downturn in some time i see on the horizon is after some bear, or "not long enough" long only capitulation later this year. We are not there yet but some shorting of calls and other top consolidation strategies will be initiated later this month. I believe this low growth low volatility environment is generally good for global companies relative to both commodities ( except precious metals), and small caps. All together the downside is limited to perhaps 5% from the top. Increasing longs on downturns is preferred to shorting highs. Bearish views should be expressed with long short trades.
No point chasing downside next week either, stay long and lighten up on strength, increase on 5-10 handles from highs.
October 4, 2012
Housing bubbles, sweden and USA
From Swedish business newspaper Dagens Industri http://www.di.se/artiklar/2012/10/4/svenskar-tror-pa-hogre-bopriser/
"Swedes believe in higher house prices"
I have updated the chart that I have produced for a couple of years now, an overlay of real swedish house prices on top of the famous chart from professor Schiller of american real house prices.
What is striking is how swedish house prices have followed american house prices with some added volatility. It is also striking that while american house prices seem to have bottomed (not very well illustrated by this chart since for american prices, it ends 2011), the economy seems to find new traction even in the industrial sector, where wages are much more competitive than in Sweden, where companies also now have the artificially highly valued swedish krona to handle.
The swedish krona is a major short for me at these levels. The previous years success of the swedish economy is based on a housing bubble, nothing else, as illustrated in this chart. Government debt levels will rise quickly as the wellfare system kicks in to compensate newly laid off people as well as eventually bailing out home owners/banks.
The swedish price series is based on the "Residential houses for permanent living" or "Småhus för permanentboende" price series deflated by the main consumer price index.

Husbubbla, Fastighetsbubbla, Sverige.
October 3, 2012
S&P 500 Earnings and revenue growth
Important big picture view of the historical earnings and revenue growth of S&P 500. Please tell me what could drive any future above average growth. It is all about QE and, at best, a very stable low growth environment.


October 2, 2012
Ray Dalio’s Big Picture View
Very important read for anyone wanting to understand the really big picture and how asset correlations differs in these different periods. This is the best description of the current status I have read so far. It is also very much in line with the view I have been advocating since 2007.
In the last few years of this stage, frequently bubbles occur. . . . These bubbles emerge because investors, businessmen, financial intermediaries, individuals, and policy makers tend to assume that the future will be like the past so they bet heavily on the trends continuing. They mistakenly believe that investments that have gone up a lot are good rather than expensive so they borrow money to buy them, which drives up their prices more and reinforces this bubble process. . . . Bubbles burst when the income growth and investment returns inevitably fall short of the levels required to service these debts. . . . The financial losses that result from the bubble bursting contribute to the country’s economic decline. Whether due to wars or bubbles or both, what typifies this stage is an accumulation of debt that can’t be paid back in nondepreciated money, which leads to the next stage.
And Stage 5:
Dalio’s big picture perspective applies not only to temporal and geographic breadth, but also to viewing the markets and economies through the lens of long-term cycles and trends. Dalio’s template for understanding economies consists of superimposing three forces that together explain the position and direction of any economy:
1. Productivity growth
—Real per capita GDP in the United States has increased at an average rate of near 2 percent over the past 100 years as a result of productivity gains, but has fluctuated widely around this trend based on the prevailing long-term and business cycles.
2. Long-term credit expansion/deleveraging cycle
—Initially, the availability of credit expands spending beyond income levels. As Dalio
explains, [This process] is self-reinforcing because rising spending generates rising incomes and rising net worths, which raise borrowers’ capacity to borrow, which allows more buying and spending. . . . The up-wave in the cycle typically goes on for decades, with variations in it primarily due to central banks tightening and easing credit (which makes business cycles).
Although self-reinforcing, the credit expansion phase ultimately reaches a point where it can no longer be extended. Dalio describes this transition in the credit cycle as follows:
It can’t go on forever. Eventually the debt service payments become equal to or larger than the amount we can borrow and the spending must decline. When promises to deliver money (debt) can’t rise any more relative to the money and credit coming in, the process works in
reverse and we have deleveragings. Since borrowing is simply a way of pulling spending forward, the person spending $110,000 per year and earning $100,000 per year has to cut his spending to $90,000 for as many years as he spent $110,000, all else being equal. . . . In deleveragings, rather than debts rising relative to money as they do in up-waves, the reverse is true. As the money coming in to debtors via incomes and borrowings is not enough to meet debtors’ obligations, assets need to be sold and spending needs to be cut in order to raise cash. This leads asset values to fall, which reduces the value of collateral, and in turn reduces incomes. Because of both lower collateral values and lower incomes, borrowers’ creditworthiness is reduced, so they justifiably get less credit, and so it continues in a selfreinforcing manner.
Dalio emphasizes that deleveragings are very different from recessions:
Unlike in recessions, when cutting interest rates and creating more money can rectify this imbalance, in deleveragings monetary policy is ineffective in creating credit. In other words, in recessions (when monetary policy is effective) the imbalance between the amount of money and the need for it to service debt can be rectified because interest rates can be cut enough to (1) ease debt service burdens, (2) stimulate economic activity because monthly debt service payments are high relative to incomes, and (3) produce a positive wealth effect; however, in deleveragings, this can’t happen. In deflationary depressions/deleveragings, monetary policy is typically ineffective in creating credit because interest rates hit 0 percent and can’t be lowered further, so other, less-effective ways of increasing money are followed. Credit growth is difficult to stimulate because borrowers remain overindebted, making sensible lending impossible. In inflationary deleveragings, monetary policy is ineffective in creating credit because increased money growth goes into other currencies and inflation hedge assets because investors fear that their lending will be paid back with money of depreciated value.
3. Business cycle
—The business cycle refers to fluctuations in economic activity. Dalio explains that “In the ‘business cycle,’ the availability and cost of credit are driven by central bankers, while in the ‘long wave cycle,’ the availability and cost of credit are driven by factors that are largely beyond central banks’ control.” In the standard business cycle, the central bank can boost a lagging economy by lowering interest rates. In the deleveraging phase of the long wave cycle, central banks can’t exert any influence by lowering rates because rates are already at or near zero.
It should now be clear why Dalio believes that any fundamental market analysis based solely on the entire post–World War II period in the United States is entirely inadequate. Although encompassing nearly 70 years, this period in the United States does not contain any deleveragings other
than the current one that began in 2008. And, as explained, economies and markets behave very differently in deleveragings than in standard recessions. By focusing more broadly through both time and geography, Dalio is able to draw upon past instances that are comparable to the current situation (e.g., Great Depression, postbubble Japan, Latin American defaults).
In regard to the cycles that affect individual countries, Dalio takes an even broader perspective, measured in centuries, which he calls, appropriately enough, “the really big picture.” Dalio believes that all countries move through a five-phase cycle:
Stage 1
—Countries are poor and think that they are poor.
Stage 2
—Countries are getting rich quickly, but still think they are poor.
Stage 3
—Countries are rich and think of themselves as rich.
Stage 4
—Countries become poorer and still think of themselves as rich.
Stage 5
—Countries go through deleveraging and relative decline, which they are slow to accept.
This is how Dalio describes countries in Stage 4:
This is the leveraging up phase—i.e., debts rise relative to incomes until they can’t anymore. . . . Because spending continues to be strong, they continue to appear rich, even though their balance sheets deteriorate. The reduced level of efficient investments in infrastructure, capital goods, and R&D slow their productivity gains. Their cities and infrastructures become older and less efficient than those in the two earlier stages. Their balance of payments positions deteriorate, reflecting their reduced competitiveness. They increasingly rely on their reputations rather than on their competitiveness to fund their deficits. They typically spend a lot of money on the military at this stage, sometimes very large amounts because of wars, in order to protect their global interests. Often, though not always, at the advanced stages of this phase, countries run “twin deficits”—i.e., both balance of payments and government deficits.
In the last few years of this stage, frequently bubbles occur. . . . These bubbles emerge because investors, businessmen, financial intermediaries, individuals, and policy makers tend to assume that the future will be like the past so they bet heavily on the trends continuing. They mistakenly believe that investments that have gone up a lot are good rather than expensive so they borrow money to buy them, which drives up their prices more and reinforces this bubble process. . . . Bubbles burst when the income growth and investment returns inevitably fall short of the levels required to service these debts. . . . The financial losses that result from the bubble bursting contribute to the country’s economic decline. Whether due to wars or bubbles or both, what typifies this stage is an accumulation of debt that can’t be paid back in nondepreciated money, which leads to the next stage.
And Stage 5:
After bubbles burst and when deleveragings occur, private debt growth, private sector spending, asset values, and net worths decline in a selfreinforcing negative cycle. To compensate, government debt growth, government deficits, and central bank “printing” of money typically increase. In this way, their central banks and central governments cut real interest rates and increase nominal GDP growth so that it is comfortably above nominal interest rates in order to ease debt burdens. As a result of these low real interest rates, weak currencies, and poor economic conditions, their debt and equity assets are poor performing and increasingly these countries have to compete with less expensive
countries that are in the earlier stages of development. Their currencies depreciate and they like it. As an extension of these economic and financial trends, countries in this stage see their power in the world decline.
The foregoing Stage 4 and Stage 5 profiles sound like uncomfortably close descriptions of the United States (Stage 5—current situation; Stage 4 preceding decades), don’t they?
October 1, 2012
Weekly update 1/10
JPMorgan adds a very good reason to be long today, which rhymes with my yearly outlook for very limited movements, or at least max/min movements in the market over the year. The reason is that even if growth potential is lower, the central bank puts around the world also means lower uncertainty and we can already see that with lower gdp volatility, as the graph shows, is on a 40 year low (at least). This implies a lower risk premia in equities vs safe assets and consequently higher equity prices. Stay long this week.

September 28, 2012
Update 9/28
The decline was swifter (this week already vs going into early next week) and deeper (3% vs 2% projected) than I actually thought it would be so I am already now maximum long in to next week. Favouring commodities and equity indices.
September 26, 2012
Update 9/26
I will take the rest of the week to close net short positions and be net long, gradually increasing the long percentage to maximum by latest middle next week.
September 25, 2012
Update 9/25
Next week will bring some macro news it will be easy for the market to sell off on, if not before. Limited downside though and the highs of the year are not set yet.
Update 2:40 PM EST.
Are you ready to buy the dip?
Update 2:40 PM EST.
Are you ready to buy the dip?
September 24, 2012
Update 9/24
The previously suggested strategy to buy dips in the market seems to hold well. I have been succesful trading .5% swings. It seems like the market sentiment is a bit too positive at the moment for the market to make another sustained up move just yet. We probably need to see a bit of a flushout beyond these sideways consolidation movements as well as a new trigger, like q3 earnings. Sell rallies and buy the 2% dip.
September 22, 2012
S&P 500 priced in gold and oil.
Is the stock market going up? Or is it just other things than the consumer price index getting more expensive?
Short SPX, Long Gold, one of my major trades for 2012 now that the next leg in central bank activism has been initiated and equities generally have squeezed away most of the risk premia.
Short SPX, Long Gold, one of my major trades for 2012 now that the next leg in central bank activism has been initiated and equities generally have squeezed away most of the risk premia.
 |
| Short SPX, Long Gold. |
.png) |
| Short SPX, Long WTI
Ritholtz posted a relating chart with gold compared to the consumer price index. That is a flawed measure in my opinion since the consumer price index will never reflect inflation at this stage in the printing cycle.
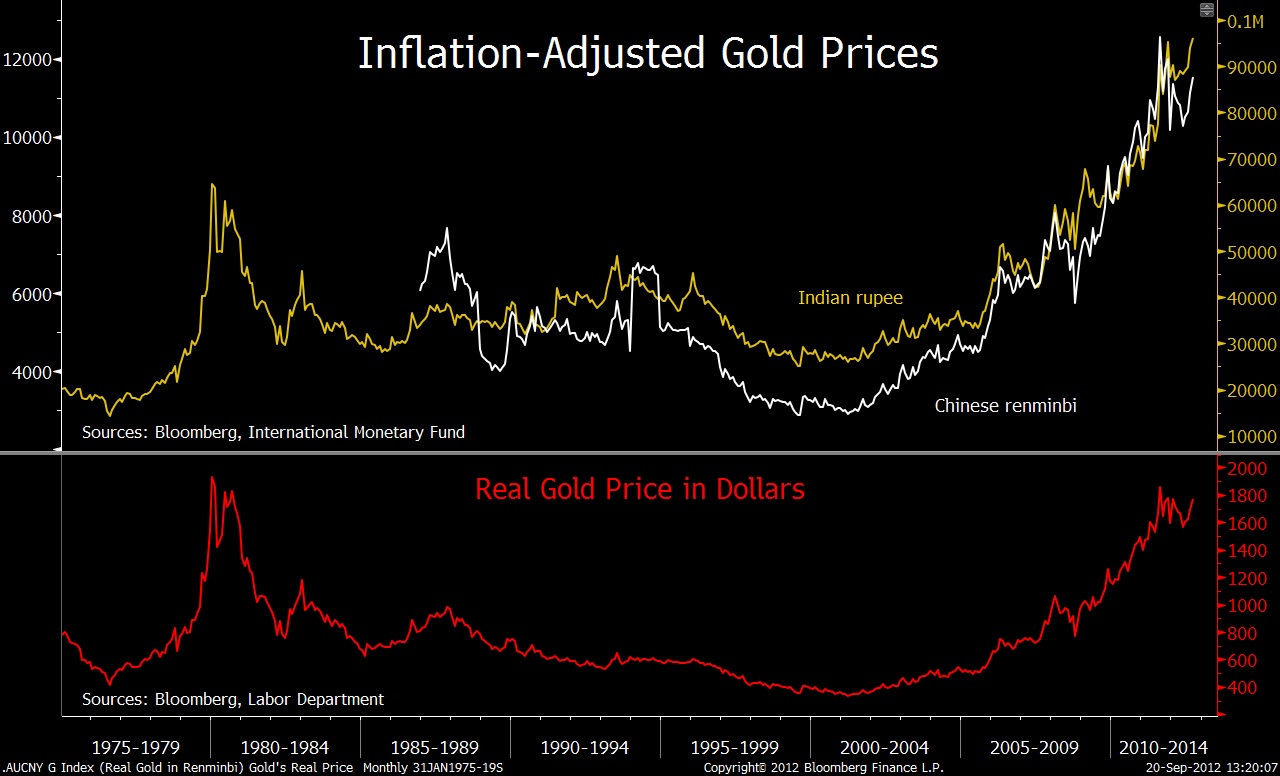
http://www.ritholtz.com/blog/2012/09/is-gold-cheap-or-expensive-look-to-china-india/
Swedish business magazine Affärsvärlden in http://www.affarsvarlden.se/tidningen/article3541208.ece relates gold with the tulip bubble. In other words, we are quite far from the contra-magazine-indicators that usually follows with a true bubble. |
Companies continue to lower Q3 guidance
This is in line with my yearly forecast point and an important trading aspect to take in to account, basically, on index level, there is no growth. At best there is 0-5% growth even next year. That said, there is not a great danger to a traditional cyclical business downturn either. So what we have is this low growth, new normal, whatever, stuff going on for some time to come.
This implies an investor need to pay attention to
a) sentiment swings.
b) p/e-levels (base case interval 11-15).
c) central banks, the monetary base and price equities in terms of gold, oil etc.
So far, 103 companies in the index have provided guidance for the third quarter. Of those, 80% have guided below Wall Street consensus estimates, according to John Butters, senior earnings analyst at FactSet. That’s the most negative outlook since FactSet began tracking the figures in the first quarter of 2006.
Adding insult to injury, S&P 500 companies are projected to see earnings drop year-over-year for the first time in 12 quarters. Third-quarter earnings are currently estimated to drop by 2.7% for the S&P 500 as a whole, the worst forecast growth rate over the past 12 quarters, Butters added. At the beginning of the quarter, analysts had been forecasting earnings growth of 1.9%.
http://blogs.marketwatch.com/thetell/2012/09/21/many-sp-500-companies-forecasting-third-quarter-misses/
In another recent article, this phenomena is demonstrated by a simple dividend model.

The model, at least the variant I will focus on for this column, is breathtakingly simple. It says that the market’s long-term return will be a function of just two things: the current dividend yield and real growth in earnings and dividends.
Since this latter growth rate over the last century has averaged about 1.4%, we can forecast what the market will do over the next decade by simply adding the market’s current dividend yield, the assumed real growth rate of 1.4%, and expected inflation.
These three components today add up to a nominal return of 5.6% annualized, according to Rob Arnott, founder of Research Affiliates, an investment advisory firm — or 3.4% in real terms.
http://www.marketwatch.com/story/stocks-future-return-just-56-annualized-2012-09-21
September 15, 2012
Update 9/14
Like the blog stated 3 days ago, central banks control the world. Open ended QE until unemployment is down to much lower levels, or something else happens before that, that is what we have before us. I would call it a world war in monetary policy. It's all in now and it is just to go with the flow. Asset classes will rise until the following scenario plays out: Food prices and other input prices rise to the point that these factors offset the positive wealth effect. At this turning point, reducing demand in the economy due to the high raw material / input prices and at the same time squeezing margins of companies. It is the only scenario that can derail this and it is not so different this time, actually it is pretty text book stuff. It is thus relative hyperinflation, perhaps not by historical standards but hyperinflation in the definition of further stimulus is no longer possible because it weakens rather than strengthens the economy. Another scenario is more political and is linked to how other countries react to the weakening of the dollar policy. The big movement is in the near future, however, completed and I will invest in buying 1-2% dips in the index next week.
September 11, 2012
Strategy update 9/11 2012
It has been some time since the last update. It was also a long time since I viewed the market as boring as I do today. "Boring" needs to be interpreted in the right way though. It is important to understand that we live in a time with so-called "financial repression". Central banks have gone all in, and thereby controls currently the world's markets. Therefore we have a low volatility environment right now and will probably have it until something goes wrong, which would be a country within the EU get enough of cutbacks, leaving the euro, or central bank activity reaches end of the road, creating inflation and / or rising input prices and falling margins and / or final demand. It's not something I see happening in the next few months and will apply the strategy layed out below until further notice. Otherwise, there is little immediate threat to the economy other than the long-factors that have been in force for many years and treated in many previous posts. These fill but more the function of a cap on growth in general, and for workers in the western world in particular, and are not so much a significant negative for the stock market.
In this environment, daytrading probably needs to be limited compared to previous years. For myself, that means significant reaollocation aprox once a week. A more basic investor should apply a strong focus on minimizing costs and to switch focus to dividends.
Sentiment studies and anecdotal reports suggest a very, if not bearishly positioned, at least "not very long" investors. Although downside ahead will be limited as long central bank puts are in place, the upside will be limited by all the aforementioned factors raised on the blog many times and remain relevant. To make clear how extreme I look at central situation. I think next year the S & P 500 moves within a 10-15% range. Approximately 5% upside and 10% downside. I will act accordingly and work with mean reversion trading.
Directionally (weekly focus), my next activity will be in coming weeks to use dips of 1-2% in major indexes to swing trade the next leg up.
Mean reversion/Consolidition (daily focus), until that leg starts we will probably be stuck in this 1-2% or less consolidition phase.
Hedged bets (monthly foxus), will consist of
a) long short trade in precious metals vs industrial metals.
Some oil will be used for long trading as well but only on unrational SPR- or other rumour related dips.
b) long short trade within tech space, long tech companies with a brand/margins, short tech companies without a brand/margins (to really simplify the strategy, but really, that is it's core).
c) long worlds largest global companies, short more regional ones of same operational focus but limited to (most interesting) Europe.
As a general note on shorting I find it more and more difficult to identify good short sales. There are some in the tech space still though but many, like AMD, LXK, LOGI have already been slaughtered and should await squeezes until new shorts on these or long/short.
October 7, 2011
Dagsuppdatering 7 oktober
Helt otroligt vilken volatilitet vi ser. Det mesta drivs av galna rykten från EU och vad jag hör så har USA svårt att tolka relevansen i dessa. Få investerare förstår t.ex. (med all rätt) hur irrelevant EU-kommissionen är. Inte ens en vecka senare och jag vill inte längre sitta i långa positioner. Svårt avgöra om ska vara lång igen in i rapportsäsongen mot slutet av nästa vecka men just nu är jag hellre neutral eller kort.
October 3, 2011
Dagsuppdatering 2 oktober
Den här veckan avser jag minska korta positioner i index och öka nettolånga exponeringen. Just idag kommer jag placera ett bet på att ISM är bättre än väntat. Utan att många har lagt märke till det har överraskningarna på makrosidan skiftat över till positivt. Jag tror vi ser en stabilisering i makro, vilket borde räcka för att ge en rekyl i index under rapporteringssäsongen.
September 23, 2011
Dagsuppdatering 23 september
Sedan föregående inlägg är OMX index ner nästan 60 punkter på mindre än en vecka. Det är i sig nog för att utvärdera sina positioner och agera med den nya information.
Jag efterlyste en bottenkörare inför Q3-rapporterna. Ett nedställ har vi fått. Jag hoppades dock att det i tid skulle ta längre tid och också omfatta t.ex. nästa sysselsättningsrapport som kommer i början av oktober.
ECBs roll är fortsatt mycket aktiv i PIGS-bonds. "Tyvärr" är det så illa ställt att trots köp i högre takt än FEDs QE1/2 så stiger räntor i PIGS, framför allt är det italien och spanien som är relevant att följa. Man verkar dock inte vilja köpa mer än att räntorna stiger sakta, för att bibehålla tryck på landet att genomföra fiskala åtgärder och att senare EFSF ska ta över stödköpen. Det är en känslig ekvation då EFSFs storlek inte räcker för att ta över ett "shock and awe"-stöd, utan måste kombineras med faktisk budgetbalans som övertygar marknaden.
Nytt sedan föregående inlägg är dagens anekdoter om massiva margin calls i det mesta; guld, silver, koppar olja. Det kan vara en kapitulation som är värd att köpa in i lite. Flera perma-bulls börjar också bli darriga på rösten och ge vika, vilket också är ett tecken på kapitulation. Jag väljer att handla lång råvaror mot kort börsindex samt lång selektiva aktier inom bl.a. tekonologi och energi/material, delvis hedgat mot index. Detta är en trade som bör kunna hållas genom Q3 rapporteringen, med ökad hedge kring vissa makrorapporter.
September 17, 2011
Månadsuppdatering september 2011
Dåligt med uppdateringar här. Hoppas någon tog föregående inlägg på allvar och intog en försiktig approach mot börsen. Jag har varit avvaktande men i spåren av ECBs välvilja(...) att köpa italienska och spanska statsobligationer har jag inte haft något annat val än att bli mer lång än jag annars skulle vilja vara. Denna långa stance är något som jag kommer skifta ut under kommande vecka och bli neutral till kort.
Allra helst vill jag se en ny bottenkörare inför Q3-rapporterna. Därför lägger jag mig net short mot mitten av veckan. Förmodligen blir FOMC en sell the news event. Framåt rapportsäsongen finns det många bolag som kommer visa siffror som är helt opåverkade av turbulensen. Måste jag välja en sektor blir det IT, men mer specifikt bolag som Intel, Apple, IBM. En lång/kort (kort index)portfölj med dessa som bas kan jag som jag ser kommande kvartal, tänka mig behålla på lång sikt.
I mer närtid gäller dock att ha respekt för ECBs köpande av PIGS-skulder. Frågan man ställer sig är omkring ECBs inblandning. Om ECB kan köpa obligationer fritt, vilket man nu gör och som är huvudfaktorn till vändningen på börsen, varför ha EFSF över huvud taget? Varför ska EFSF gälla Grekland, Portugal, Irland men ECB tar hand om Italien och Spanien (samt även övriga)...
Givetvis är det för att EFSF är för liten för att ta hand om Italien och Spanien. ECB har redan, på två månader, köpt omkring halva EFSFs kapacitet i PIGS-bonds.
Så, vad är egentligen skillnaden mellan centralbank (penningpolitik), finanspolitik, enskilda länder samt EMU som region... Jag ser det inte.
Detta är ett politiskt problem som kommer växa sig starkare och starkare tills folket, både i pigs-länderna och rescue-länderna, säger ifrån.
September 1, 2011
Dagsuppdatering 1 september
Alldeles fruktansvärt dåliga PMIs för europa har släppts på morgonen. Bear caset är mer aktivt än någon gång under senaste två åren, även med hänsyn tagen till nedgången som redan varit. Nu när även Tyskland stagnerar (PMI 50,9) och Spanien (PMI 44) och Italien(PMI 47) fortsätter uppvisa trend mot allt större budgetunderskott, är frågan hur länge det är politiskt möjligt men framför allt bland väljarna, möjligt att subventionera sydstaterna.
Samtidigt kryper spanska och italienska räntorna uppåt igen. ECB lär inte gilla att Italien "drar ner" på utlovade på neddragningar.
Det här är en riktigt allvarlig situation och i de flesta fallen kommer den inte förmedlas korrekt av main stream media och anlytiker som, om "mitt" case realiseras, i de flesta fall blir av med sina jobb, bonusar och hus.
August 31, 2011
Dagsuppdatering 31 augusti
Månadsskifteseffekt, lättnadsrally, sentimentneutralisering har allt verkar för att vi skulle få den där rekylen upp. Nu tar jag position enbart för nedgång i riskfyllda tillgångar.
August 17, 2011
Dagsuppdatering 16 augusti
En generell betraktelse, en kommentar kring Merkozy-mötet och en marknadsprognos.
Kriget mellan de s.k fundamentalisterna och vad man kan kalla makroinvesterare härjar nu för fullt. Det är intressant att lyssna på båda sidor och man måste analysera deras uppväxt tidsenliga bildning för att förstå deras argument. Fundamentalisterna har under 50 år aldrig behövt ta hänsyn till makrovariabler. Världen har växt i snabb takt och därför har det endast handlat om att undvika bolag som mot förmodan skulle misslyckas i en sådan miljö. Dessa människor fortsätter med det här beteendet. Men oddsen har förändrats. Nu handlar det om att hitta de få bolag som klarar sig i en miljö med i bästa fall tillväxt runt 1%. Buy and hold indexinvesteringar är dödsdömda. Jag ser det som att man har en säljpremie genom att detta fundamentala kollektiv biddar upp priserna över dess jämviktsnivå. Det kommer pågå tills dessa fundamentalister utrotats eller gått över till den andra sidan och förstår att makro spelar roll.
Det börjar bli lite väl enkelt att gå lång när ett möte utannonseras och kort alldeles inför presskonferensen. Den här gången lyckades dock Merkozy att överträffa sig själva i att leverera vad marknaden inte vill höra. Transaktionsskatt? EFSF är tillräckligt stor? ECB köpte 22bn EUR av IS-obligationer senaste veckan. Det innebär drygt två månader av EFSF-kapacitet. Fler och fler beslut verkar tas över huvudet på invånarna, utan någon ambition att förklara en långsiktig plan, eller ens en kortsiktig motivering. Det här skapar sprickor. Om man hade kunnat laga hålet vid första försöket kanske folkmassan hade antingen haft överseende eller snabbt glömt bort det. Men nu är det återkommande maktfullkomligheter från team Merkozy vecka efter vecka och det får folk att säga ifrån. Team M försöker till varje pris hålla ihop euron utan att omgående bli sparkade från sina positioner. Ironiskt nog kan det leda till just motsatsen, sammanbrott av EU och uppkomsten av nationalistiska partier. Har M glömt vad som kan hända?
Marknaden. Innan dagens möte hade jag tänkt åka med marknaden upp en bit till. Det här förändrar en del. Blir intressant att se hur europa reagerar imorgon. Situationen kan jämföras med ett extremt chicken race där du kör mot en galen italienare med en spanjor som kartläsare. Alla upprekyler handlar om att gå kort. Lyckas man plocka lite lång-pengar är det en bonus. Mina grafer och sentimentindikatorer säger att vi kan pressas upp, framför allt vill USA upp till och med optionslösen på fredag. Frågan blir om europas vilja att gå ner tar överhanden. Jag ser uppsida på max 5% och nedsida som är allt från 5 till 20% i en snabb rörelse så positioneringsvikten är åt nedsidan.
July 21, 2011
Dagsuppdatering 21 juli
Den "stora europeiska lösningen" version 74 har nu släppts. Därmed är det åter säkrare att gå kort på dessa nivåer och få med sig både framtida fortsatta EU-problem och den allt tydligare reala ekonomiska försvagnignen.
July 14, 2011
July 11, 2011
Dagsuppdatering
Perfekt timing i föregående inlägg. Det här kan mycket väl bli en ordentlig krasch. Italien är den tredje största ekonomin i europa. Där har 10-åriga obligationsräntor stigit med 1 procent på en vecka. Det finns inget politiskt stöd eller ekonomiska resurser för att rädda Italien som kommer dra med sig allt annat, innebära haircuts på obligationer, vilket också sprids till övriga länder.
Väldigt få banker kommer vara solventa när alla haircuts är genomförda.
Hoppas bara det inte kraschar så mycket att samhället bryter samman.
Väldigt få banker kommer vara solventa när alla haircuts är genomförda.
Hoppas bara det inte kraschar så mycket att samhället bryter samman.
July 1, 2011
Månadsuppdatering juli 2011
Nyheterna om Grekland har nu nått ut till världens alla hörn och därmed kan vi anta att Grekland för en tid framöver är irrelevant för investeringsbeslut. I mitt föregående inlägg skrev jag om en svåranalyseras digital politisk risk, den kan vi nu till stor del bortse från.
Hur ska då positioner tas? Backspegeln säger att marknaden var kraftigt bearish och det i sig var tillräckligt att ge uppgång även med en relativt svag grekisk utgång (knapp majoritet i omröstningen). Samtidigt finns hela tiden värderingsstödet där (se tidigare inlägg om plus och minus-faktorer).
I den stora makrobilden arbetar jag dock fortfarande utifrån följande hypoteser
- QE2 är över och kommer därmed inte ge samma stöd åt finansiella tillgångar, råvaror, aktier, ränta.
- Makrobilden är försvagad, cykliska återhämtningen är till stor del över i väst.
- Arbetslöshetssiffror klänger sig kvar på hög nivå vilket hämmar privatkonsumtionen samtidigt som regeringar drar åt budgeten.
- Oljepriset steg återigen till nivåer som närmast leder till recession och faller därefter snabbt tillbaka. Vi har sett det förr och kommer få se det igen så länge vi är beroende av oljan för tillväxt (peak growth/oil).
- Viktigast: Marknaden tror att makro endast försvagades pga Japan och därmed återgår till normalläge H2 2011. Är det så, är dock aktier mycket köpvärda. Studie av makroflödet är därmed viktigt. Idag kommer ISM för juni, andra serier att följa är weekly initial jobless claims samt hur PMI i Kina utvecklas. Siffran som släpptes idag landade på 50,9 och därmed knappt tillväxt. Tittar man på detaljerna är det ännu sämre. Delindexet över exportorderingången sjönk från 49,7 till 46,7 och är nu på sin lägsta nivå sedan mars 2009. Delindexet över färdiga lagervaror backade märkbart från 48,6 till 46,9, också det den lägsta siffran sedan mars 2009.
- När marknaden nu inom någon dag, mitten nästa vecka, neutraliserat det överdrivna bearisha sentimentet tror jag vi kan göra oss redo att ta korta positioner för scenariot ovan. Mikrotrading säger att vi kan stänga ned idag på svag ISM men att rekylen upp fortsätter någon dag nästa vecka.
June 15, 2011
Grekland
Dags att gå tillbaka till berättelsen om Grekland.
Kommande vecka lär det här drachmat nå sin finale. Kom ihåg hypotesen, den svarta svanen, att folket runt om i Europa blir den faktor som säger ifrån - "Sluta lek med oss" till EU, IMF, och världens finansmarknader.
Läget är fortsatt som följer. Grekland behöver pengar. EUs ledare och folk är enbart redo att ge Grekerna pengar om de går i pension samtidigt som övriga, ökar skatter, minskar transfereringar osv. Allt detta kanske skulle gå igenom om inget annat hände, men problemet är att en ekonomi som redan befinner sig i recession skulle gå in i en depression med dessa krävda och planerade neddragningar. Pest eller kolera, spelar inte så stor roll för Grekerna. Varför inte bara skita i allt och på köpet ge en rejäl känga till omvärlden.
Framför allt kommer problemen eskalera när samma sak händer i Spanien... Portugal.. och Irland. Europas unga lever i fattigdom på bekostnad av aktiemarknaden. Det förhållandet är absurt nog också anledningen till den starka aktiemarknaden. Resultatet är alltså en väldigt digital värld, där allt faller om folket får det tillräckligt dåligt men fortsätter stiga om folket bara har det lagom dåligt...
Så vad krävs för att lyckas med investeringar? Politisk analys och sentimentanalys. Släng alla kassaflödesanalyser ut genom fönstret det kommande året.
Tillägg 2011-06-18: Nu kör även Aftonbladet igång på allvar med en kritisk granskning av grekerna! Härligt. Granska också våra svenska politiker som vill fortsätta att pumpa pengar till grekerna och ställ de obekväma frågorna som verkar vara än mer politiskt inkorrekta att ta i än t.ex. invandringen till Sverige.
http://www.aftonbladet.se/nyheter/analys/wolfganghansson/article13192602.ab
http://www.aftonbladet.se/nyheter/article13192165.ab
http://www.dn.se/ekonomi/skuldrekonstruktion-i-grekland-oundviklig
http://www.dn.se/ekonomi/mentaliteten-ar-greklands-problem
Dagsuppdatering 15 juni
Jag gillar vad jag ser i negativt sentiment kontra nyhetsflöde och fortsätter att sitta på mestadels långa positioner initierade i slutet av förra veckan. Just nu är dock hypotesen att det inte blir en uppgång till nya highs, utan att vi fortsätter i en konsolideringsfas med stöd från företagen och värderingar och motstånd i makro.
Tillägg 15/6. För mycket kring Grekland nu och eventuell ny regering som kommer ge en ny spik nedåt i aktieindex. Svår rörelse nu när det är översålt och minsta lilla positiv nyhet kan ge ett rally. Tanken var att kunna gå kort från en högre nivå, nu är jag inklämd mellan köp och säljnivå. Stänger lång position på break even och letar möjlighet att gå kort.
Tillägg 15/6. För mycket kring Grekland nu och eventuell ny regering som kommer ge en ny spik nedåt i aktieindex. Svår rörelse nu när det är översålt och minsta lilla positiv nyhet kan ge ett rally. Tanken var att kunna gå kort från en högre nivå, nu är jag inklämd mellan köp och säljnivå. Stänger lång position på break even och letar möjlighet att gå kort.
June 8, 2011
Dagsuppdatering 7 juni
Bra nedgång på kort tid. Jag tror att vi kommer få en lägre lägsta innan en betydelsefull rekyl, men också troligt med en kortare neutraliserande upprekyl mot slutet av den här veckan.
Subscribe to:
Posts (Atom)