As mentioned in the previous post I was a seller in to the santa rally. Generally, I like to position myself by entering or exiting trades in two dimensions, both time and "space"/price. An example would be the last weeks where I have a view on selling in to a coming rally and therefore taking positions over a time of aprox two weeks, at regular intervals. Half my position is created that way and the other half by taking action on pre set index levels.
Even considering last few years of totally central bank and politics driven markets, this market right now is extremely event driven out of Washington. It is very likely we get a whipsaw movements depending on what happens in the next few days. I have a clear strategy how to play it and it rhymes with what I have advocated here many times last few years. Simplified it is:
Sell the rally and buy the dip.
That single statement is the most important to remember going forward as well and my strategy piece for 2013 would be titled exactly that. There simply is no real long term growth driver like previous 30 years and there simply is too much intervention in price levels for a large price decline.
More short termish, any excessive reaction to the fiscal cliff will be mean reversion traded. In the next few weeks, no matter the outcome, I think we will test around 1350 in the S&P. But that level will be bought by me. How to react to the following upswing to 1400-1430 again is another story.
For 2013 some of my themes that I will trade around will be:
Short base metals and crude oil against equities and gold (on a flush out of extreme bullishness in gold).
Short relative small cap tech companies against large global mega cap tech companies.
Long global mega cap companies.
Long USD vs SEK.
Long SPX vs OMX.
Sell volatility on any spike.
Happy new year!

December 31, 2012
December 3, 2012
Weekly update 12/3
I am a seller in to all rallies now. I would also, contrary to previous post, not hold longs in precious metals.

Very weak technicals here with negative divergences in weekly RSI translating in to long term weakness in prices.


Very weak technicals here with negative divergences in weekly RSI translating in to long term weakness in prices.

November 28, 2012
Weekly update 11/28
Looking to increase longs in to this weakness but it is not without hedging. There are many weak equity names out there and looking at the bigger macro picture, there are industrial metals and energy that are relatively weak and continue to be good hedges (something I have stressed for some months now) against equity longs. Precious metals continue to be good longs as well.
This could be the last upmove in equities before we get a bigger correction going (both in time and space). Emerging markets are horribly weak and also some developed markets like export oriented Sweden which also has not had its housing market crash yet (but it will), compared with for example the S&P. So there are many ways to setup long/short portfolios in this environment.
In many markets it is obvious that central bank actions are boosting financials relative to industrial. This I take as a sign as the final push higher, when fundamentals (layoffs) catch up, it will hurt everyone. But it is more - both in fundamental analys and technical analysis - a projection about generally "dead" markets than something that will crash like post 2000 and 2008.


November 25, 2012
Weekly update
Ok, so the projection from last week was to look for a brief flushout starting Monday. It will be very important to see how the emerging markets are behaving, considering the weak technical picture shown in the earlier post. With holiday volumes here in the west, it is easy to envision a slow pain trade grind with a positive bias simply because of the negative positioning and sentiment. But there is something potentially very weak out there which deserves to be taken very seriously. I would not trade with more than 50% of normal volume until there is more clarity. Are these markets ready to really break higher? I doubt so and would rather than participate in the upside, decrease longs the coming weeks and end up fully net short by the end of the year.
November 21, 2012
Weekly update 11/21
Election squeeze, and over done sell off and now right back at 1390. A lot of technical damage was done the last weeks. If the SPX looks bad, commodities like oil and copper and some tech names are outright horrible. The only factor that is worse than these charts is sentiment. Sentiment is so bearish it only takes a minor piece of good news, like a half hearted fiscal cliff solution, to push this market to around year highs.


I am looking for a brief decline post thanksgiving to flush out some of the swing bulls and then a continued bearish sentiment driven squeeze to around new highs. This position could easily be hedged by short positions in some commodities as well as a long position in the dollar. It looks like emerging markets will lead the way to the downside after this final squeeze. Right now, let the option premium decay in to the low volatility holiday season.
November 6, 2012
Weekly update 11/6
I would recommend using an election squeeze to light up on longs. Also, those sold puts are moving towards 0. I would not stress about hedging that position, rather selling some calls on the squeeze depending on how vol moves post elections. Selling calls and buying puts is the more aggressive trade. I believe we have a sideways consolidating market with a bias towards the downside as time progresses. Therefore selling vol strike november and buying vol strike december could be the best strategy.
I also recommend creating long short portfolios, shorting weak technology names and going long index. Oil and copper also looks like a good shorts on this squeeze.
I also recommend creating long short portfolios, shorting weak technology names and going long index. Oil and copper also looks like a good shorts on this squeeze.
October 31, 2012
Weekly update 10/31
After a week of wound licking I am ready for a new position in the market. With SPX at 1405 and projected range of 1400-1500 in to the new year, the area around 1400, especially given elevated vix, is excellent for selling atm puts. I am prepared for perhaps one final shakeout so I take half the position now and half on an event related move higher or on a shakeout between 1390 and 1400.

The vix is at 18.6 vs a realized SPX 20-day volatility ~10, which strengthens the case of selling option premium.
October 23, 2012
October 22, 2012
Weekly update 10/22
Continue to just buy the fucking dip and complement that with selling ATM nov/dec puts to take advantage of the relatively high option premiums at the moment. Let time do it's magic!
October 20, 2012
October 13, 2012
Weekly update 13/10
The slow grind consolidation phase has continued in time and levels a bit beyond my first estimation. At the same time China seems to be breaking out to the upside and outperforming, a much welcome development compared to basically the last two years. WHEN the market turns up again, with ok earnings as a catalyst, new highs will be in in less than half the time it took to consolidate down to these levels around 1430.
Relative strength and weakness studies show that it will continue to be a good investment strategy to be long SPX and short countries with strong currencies like SWEDEN. That can also be hedged by a long position in USDSEK.
Relative strength and weakness studies show that it will continue to be a good investment strategy to be long SPX and short countries with strong currencies like SWEDEN. That can also be hedged by a long position in USDSEK.
October 7, 2012
Weekly update 7/10
Someone recently asked me how I, as one in many ways quite bearish macro guy, can stay bullish on equities. I have pointed this out on several occations rcently but here I go again;
1) central banks
2) companies are the finest materia on earth, valuations, debt levels etc.
3) a generally bearish investment community
4) a lean business cycle without general excess production that would cause a traditional recession.
(1) is a long term play. We will obviously have tradable downturns of +5% even during this period of central bank activism. But probably not until either of (2), (3) or (4) turns negative. The first tradable downturn in some time i see on the horizon is after some bear, or "not long enough" long only capitulation later this year. We are not there yet but some shorting of calls and other top consolidation strategies will be initiated later this month. I believe this low growth low volatility environment is generally good for global companies relative to both commodities ( except precious metals), and small caps. All together the downside is limited to perhaps 5% from the top. Increasing longs on downturns is preferred to shorting highs. Bearish views should be expressed with long short trades.
No point chasing downside next week either, stay long and lighten up on strength, increase on 5-10 handles from highs.
October 4, 2012
Housing bubbles, sweden and USA
From Swedish business newspaper Dagens Industri http://www.di.se/artiklar/2012/10/4/svenskar-tror-pa-hogre-bopriser/
"Swedes believe in higher house prices"
I have updated the chart that I have produced for a couple of years now, an overlay of real swedish house prices on top of the famous chart from professor Schiller of american real house prices.
What is striking is how swedish house prices have followed american house prices with some added volatility. It is also striking that while american house prices seem to have bottomed (not very well illustrated by this chart since for american prices, it ends 2011), the economy seems to find new traction even in the industrial sector, where wages are much more competitive than in Sweden, where companies also now have the artificially highly valued swedish krona to handle.
The swedish krona is a major short for me at these levels. The previous years success of the swedish economy is based on a housing bubble, nothing else, as illustrated in this chart. Government debt levels will rise quickly as the wellfare system kicks in to compensate newly laid off people as well as eventually bailing out home owners/banks.
The swedish price series is based on the "Residential houses for permanent living" or "Småhus för permanentboende" price series deflated by the main consumer price index.

Husbubbla, Fastighetsbubbla, Sverige.
October 3, 2012
S&P 500 Earnings and revenue growth
Important big picture view of the historical earnings and revenue growth of S&P 500. Please tell me what could drive any future above average growth. It is all about QE and, at best, a very stable low growth environment.


October 2, 2012
Ray Dalio’s Big Picture View
Very important read for anyone wanting to understand the really big picture and how asset correlations differs in these different periods. This is the best description of the current status I have read so far. It is also very much in line with the view I have been advocating since 2007.
In the last few years of this stage, frequently bubbles occur. . . . These bubbles emerge because investors, businessmen, financial intermediaries, individuals, and policy makers tend to assume that the future will be like the past so they bet heavily on the trends continuing. They mistakenly believe that investments that have gone up a lot are good rather than expensive so they borrow money to buy them, which drives up their prices more and reinforces this bubble process. . . . Bubbles burst when the income growth and investment returns inevitably fall short of the levels required to service these debts. . . . The financial losses that result from the bubble bursting contribute to the country’s economic decline. Whether due to wars or bubbles or both, what typifies this stage is an accumulation of debt that can’t be paid back in nondepreciated money, which leads to the next stage.
And Stage 5:
Dalio’s big picture perspective applies not only to temporal and geographic breadth, but also to viewing the markets and economies through the lens of long-term cycles and trends. Dalio’s template for understanding economies consists of superimposing three forces that together explain the position and direction of any economy:
1. Productivity growth
—Real per capita GDP in the United States has increased at an average rate of near 2 percent over the past 100 years as a result of productivity gains, but has fluctuated widely around this trend based on the prevailing long-term and business cycles.
2. Long-term credit expansion/deleveraging cycle
—Initially, the availability of credit expands spending beyond income levels. As Dalio
explains, [This process] is self-reinforcing because rising spending generates rising incomes and rising net worths, which raise borrowers’ capacity to borrow, which allows more buying and spending. . . . The up-wave in the cycle typically goes on for decades, with variations in it primarily due to central banks tightening and easing credit (which makes business cycles).
Although self-reinforcing, the credit expansion phase ultimately reaches a point where it can no longer be extended. Dalio describes this transition in the credit cycle as follows:
It can’t go on forever. Eventually the debt service payments become equal to or larger than the amount we can borrow and the spending must decline. When promises to deliver money (debt) can’t rise any more relative to the money and credit coming in, the process works in
reverse and we have deleveragings. Since borrowing is simply a way of pulling spending forward, the person spending $110,000 per year and earning $100,000 per year has to cut his spending to $90,000 for as many years as he spent $110,000, all else being equal. . . . In deleveragings, rather than debts rising relative to money as they do in up-waves, the reverse is true. As the money coming in to debtors via incomes and borrowings is not enough to meet debtors’ obligations, assets need to be sold and spending needs to be cut in order to raise cash. This leads asset values to fall, which reduces the value of collateral, and in turn reduces incomes. Because of both lower collateral values and lower incomes, borrowers’ creditworthiness is reduced, so they justifiably get less credit, and so it continues in a selfreinforcing manner.
Dalio emphasizes that deleveragings are very different from recessions:
Unlike in recessions, when cutting interest rates and creating more money can rectify this imbalance, in deleveragings monetary policy is ineffective in creating credit. In other words, in recessions (when monetary policy is effective) the imbalance between the amount of money and the need for it to service debt can be rectified because interest rates can be cut enough to (1) ease debt service burdens, (2) stimulate economic activity because monthly debt service payments are high relative to incomes, and (3) produce a positive wealth effect; however, in deleveragings, this can’t happen. In deflationary depressions/deleveragings, monetary policy is typically ineffective in creating credit because interest rates hit 0 percent and can’t be lowered further, so other, less-effective ways of increasing money are followed. Credit growth is difficult to stimulate because borrowers remain overindebted, making sensible lending impossible. In inflationary deleveragings, monetary policy is ineffective in creating credit because increased money growth goes into other currencies and inflation hedge assets because investors fear that their lending will be paid back with money of depreciated value.
3. Business cycle
—The business cycle refers to fluctuations in economic activity. Dalio explains that “In the ‘business cycle,’ the availability and cost of credit are driven by central bankers, while in the ‘long wave cycle,’ the availability and cost of credit are driven by factors that are largely beyond central banks’ control.” In the standard business cycle, the central bank can boost a lagging economy by lowering interest rates. In the deleveraging phase of the long wave cycle, central banks can’t exert any influence by lowering rates because rates are already at or near zero.
It should now be clear why Dalio believes that any fundamental market analysis based solely on the entire post–World War II period in the United States is entirely inadequate. Although encompassing nearly 70 years, this period in the United States does not contain any deleveragings other
than the current one that began in 2008. And, as explained, economies and markets behave very differently in deleveragings than in standard recessions. By focusing more broadly through both time and geography, Dalio is able to draw upon past instances that are comparable to the current situation (e.g., Great Depression, postbubble Japan, Latin American defaults).
In regard to the cycles that affect individual countries, Dalio takes an even broader perspective, measured in centuries, which he calls, appropriately enough, “the really big picture.” Dalio believes that all countries move through a five-phase cycle:
Stage 1
—Countries are poor and think that they are poor.
Stage 2
—Countries are getting rich quickly, but still think they are poor.
Stage 3
—Countries are rich and think of themselves as rich.
Stage 4
—Countries become poorer and still think of themselves as rich.
Stage 5
—Countries go through deleveraging and relative decline, which they are slow to accept.
This is how Dalio describes countries in Stage 4:
This is the leveraging up phase—i.e., debts rise relative to incomes until they can’t anymore. . . . Because spending continues to be strong, they continue to appear rich, even though their balance sheets deteriorate. The reduced level of efficient investments in infrastructure, capital goods, and R&D slow their productivity gains. Their cities and infrastructures become older and less efficient than those in the two earlier stages. Their balance of payments positions deteriorate, reflecting their reduced competitiveness. They increasingly rely on their reputations rather than on their competitiveness to fund their deficits. They typically spend a lot of money on the military at this stage, sometimes very large amounts because of wars, in order to protect their global interests. Often, though not always, at the advanced stages of this phase, countries run “twin deficits”—i.e., both balance of payments and government deficits.
In the last few years of this stage, frequently bubbles occur. . . . These bubbles emerge because investors, businessmen, financial intermediaries, individuals, and policy makers tend to assume that the future will be like the past so they bet heavily on the trends continuing. They mistakenly believe that investments that have gone up a lot are good rather than expensive so they borrow money to buy them, which drives up their prices more and reinforces this bubble process. . . . Bubbles burst when the income growth and investment returns inevitably fall short of the levels required to service these debts. . . . The financial losses that result from the bubble bursting contribute to the country’s economic decline. Whether due to wars or bubbles or both, what typifies this stage is an accumulation of debt that can’t be paid back in nondepreciated money, which leads to the next stage.
And Stage 5:
After bubbles burst and when deleveragings occur, private debt growth, private sector spending, asset values, and net worths decline in a selfreinforcing negative cycle. To compensate, government debt growth, government deficits, and central bank “printing” of money typically increase. In this way, their central banks and central governments cut real interest rates and increase nominal GDP growth so that it is comfortably above nominal interest rates in order to ease debt burdens. As a result of these low real interest rates, weak currencies, and poor economic conditions, their debt and equity assets are poor performing and increasingly these countries have to compete with less expensive
countries that are in the earlier stages of development. Their currencies depreciate and they like it. As an extension of these economic and financial trends, countries in this stage see their power in the world decline.
The foregoing Stage 4 and Stage 5 profiles sound like uncomfortably close descriptions of the United States (Stage 5—current situation; Stage 4 preceding decades), don’t they?
October 1, 2012
Weekly update 1/10
JPMorgan adds a very good reason to be long today, which rhymes with my yearly outlook for very limited movements, or at least max/min movements in the market over the year. The reason is that even if growth potential is lower, the central bank puts around the world also means lower uncertainty and we can already see that with lower gdp volatility, as the graph shows, is on a 40 year low (at least). This implies a lower risk premia in equities vs safe assets and consequently higher equity prices. Stay long this week.

September 28, 2012
Update 9/28
The decline was swifter (this week already vs going into early next week) and deeper (3% vs 2% projected) than I actually thought it would be so I am already now maximum long in to next week. Favouring commodities and equity indices.
September 26, 2012
Update 9/26
I will take the rest of the week to close net short positions and be net long, gradually increasing the long percentage to maximum by latest middle next week.
September 25, 2012
Update 9/25
Next week will bring some macro news it will be easy for the market to sell off on, if not before. Limited downside though and the highs of the year are not set yet.
Update 2:40 PM EST.
Are you ready to buy the dip?
Update 2:40 PM EST.
Are you ready to buy the dip?
September 24, 2012
Update 9/24
The previously suggested strategy to buy dips in the market seems to hold well. I have been succesful trading .5% swings. It seems like the market sentiment is a bit too positive at the moment for the market to make another sustained up move just yet. We probably need to see a bit of a flushout beyond these sideways consolidation movements as well as a new trigger, like q3 earnings. Sell rallies and buy the 2% dip.
September 22, 2012
S&P 500 priced in gold and oil.
Is the stock market going up? Or is it just other things than the consumer price index getting more expensive?
Short SPX, Long Gold, one of my major trades for 2012 now that the next leg in central bank activism has been initiated and equities generally have squeezed away most of the risk premia.
Short SPX, Long Gold, one of my major trades for 2012 now that the next leg in central bank activism has been initiated and equities generally have squeezed away most of the risk premia.
 |
| Short SPX, Long Gold. |
.png) |
| Short SPX, Long WTI
Ritholtz posted a relating chart with gold compared to the consumer price index. That is a flawed measure in my opinion since the consumer price index will never reflect inflation at this stage in the printing cycle.
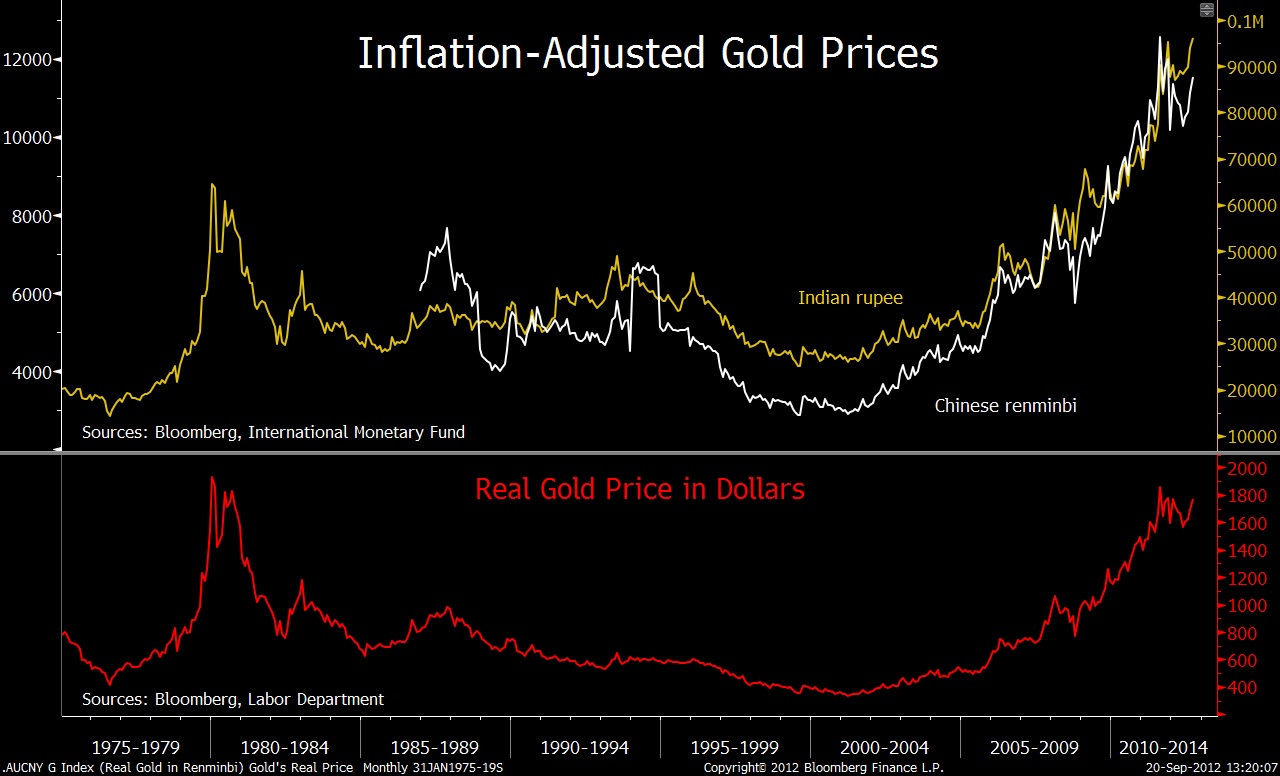
http://www.ritholtz.com/blog/2012/09/is-gold-cheap-or-expensive-look-to-china-india/
Swedish business magazine Affärsvärlden in http://www.affarsvarlden.se/tidningen/article3541208.ece relates gold with the tulip bubble. In other words, we are quite far from the contra-magazine-indicators that usually follows with a true bubble. |
Companies continue to lower Q3 guidance
This is in line with my yearly forecast point and an important trading aspect to take in to account, basically, on index level, there is no growth. At best there is 0-5% growth even next year. That said, there is not a great danger to a traditional cyclical business downturn either. So what we have is this low growth, new normal, whatever, stuff going on for some time to come.
This implies an investor need to pay attention to
a) sentiment swings.
b) p/e-levels (base case interval 11-15).
c) central banks, the monetary base and price equities in terms of gold, oil etc.
So far, 103 companies in the index have provided guidance for the third quarter. Of those, 80% have guided below Wall Street consensus estimates, according to John Butters, senior earnings analyst at FactSet. That’s the most negative outlook since FactSet began tracking the figures in the first quarter of 2006.
Adding insult to injury, S&P 500 companies are projected to see earnings drop year-over-year for the first time in 12 quarters. Third-quarter earnings are currently estimated to drop by 2.7% for the S&P 500 as a whole, the worst forecast growth rate over the past 12 quarters, Butters added. At the beginning of the quarter, analysts had been forecasting earnings growth of 1.9%.
http://blogs.marketwatch.com/thetell/2012/09/21/many-sp-500-companies-forecasting-third-quarter-misses/
In another recent article, this phenomena is demonstrated by a simple dividend model.

The model, at least the variant I will focus on for this column, is breathtakingly simple. It says that the market’s long-term return will be a function of just two things: the current dividend yield and real growth in earnings and dividends.
Since this latter growth rate over the last century has averaged about 1.4%, we can forecast what the market will do over the next decade by simply adding the market’s current dividend yield, the assumed real growth rate of 1.4%, and expected inflation.
These three components today add up to a nominal return of 5.6% annualized, according to Rob Arnott, founder of Research Affiliates, an investment advisory firm — or 3.4% in real terms.
http://www.marketwatch.com/story/stocks-future-return-just-56-annualized-2012-09-21
September 15, 2012
Update 9/14
Like the blog stated 3 days ago, central banks control the world. Open ended QE until unemployment is down to much lower levels, or something else happens before that, that is what we have before us. I would call it a world war in monetary policy. It's all in now and it is just to go with the flow. Asset classes will rise until the following scenario plays out: Food prices and other input prices rise to the point that these factors offset the positive wealth effect. At this turning point, reducing demand in the economy due to the high raw material / input prices and at the same time squeezing margins of companies. It is the only scenario that can derail this and it is not so different this time, actually it is pretty text book stuff. It is thus relative hyperinflation, perhaps not by historical standards but hyperinflation in the definition of further stimulus is no longer possible because it weakens rather than strengthens the economy. Another scenario is more political and is linked to how other countries react to the weakening of the dollar policy. The big movement is in the near future, however, completed and I will invest in buying 1-2% dips in the index next week.
September 11, 2012
Strategy update 9/11 2012
It has been some time since the last update. It was also a long time since I viewed the market as boring as I do today. "Boring" needs to be interpreted in the right way though. It is important to understand that we live in a time with so-called "financial repression". Central banks have gone all in, and thereby controls currently the world's markets. Therefore we have a low volatility environment right now and will probably have it until something goes wrong, which would be a country within the EU get enough of cutbacks, leaving the euro, or central bank activity reaches end of the road, creating inflation and / or rising input prices and falling margins and / or final demand. It's not something I see happening in the next few months and will apply the strategy layed out below until further notice. Otherwise, there is little immediate threat to the economy other than the long-factors that have been in force for many years and treated in many previous posts. These fill but more the function of a cap on growth in general, and for workers in the western world in particular, and are not so much a significant negative for the stock market.
In this environment, daytrading probably needs to be limited compared to previous years. For myself, that means significant reaollocation aprox once a week. A more basic investor should apply a strong focus on minimizing costs and to switch focus to dividends.
Sentiment studies and anecdotal reports suggest a very, if not bearishly positioned, at least "not very long" investors. Although downside ahead will be limited as long central bank puts are in place, the upside will be limited by all the aforementioned factors raised on the blog many times and remain relevant. To make clear how extreme I look at central situation. I think next year the S & P 500 moves within a 10-15% range. Approximately 5% upside and 10% downside. I will act accordingly and work with mean reversion trading.
Directionally (weekly focus), my next activity will be in coming weeks to use dips of 1-2% in major indexes to swing trade the next leg up.
Mean reversion/Consolidition (daily focus), until that leg starts we will probably be stuck in this 1-2% or less consolidition phase.
Hedged bets (monthly foxus), will consist of
a) long short trade in precious metals vs industrial metals.
Some oil will be used for long trading as well but only on unrational SPR- or other rumour related dips.
b) long short trade within tech space, long tech companies with a brand/margins, short tech companies without a brand/margins (to really simplify the strategy, but really, that is it's core).
c) long worlds largest global companies, short more regional ones of same operational focus but limited to (most interesting) Europe.
As a general note on shorting I find it more and more difficult to identify good short sales. There are some in the tech space still though but many, like AMD, LXK, LOGI have already been slaughtered and should await squeezes until new shorts on these or long/short.
Subscribe to:
Posts (Atom)