WTI, Light Crude Oil, Update, note real time quote @ 92
Silver
Gold
SPX - looking for a blow off top between 1530 and 1550, then some sideways/down action until we build a base.
Bull against bear
Financial markets, macro economics, politics and everything else concerning the global markets. The writer is a long time investment banking operative in the nordic markets. The blog is usually updated once a week with specific trading advice. On a monthly basis, the goal is to provide a strategy update. In addition to that, there will be posts of more general content, housing bubbles, investment strategies and more.
Showing posts with label charts. Show all posts
February 28, 2013
February 18, 2013
January 25, 2013
Chart update 1/25
S&P now at 1502. A lot of people have jumped on the bandwagon the last week. Earnings and Revenues are not super great but they are there and equities are valued at around p/e 15 on this years earnings. Apple is yielding more than 10Y US Treasuries. I am not saying 10Y US Treasuries would be where they are without the FED's actions but still, there are bullish cases to be made and as long as that is the case, the bullish bandwagon is to be respected.
Considering the rapid rise and many days without correction I think the market will frustrate the hell out of both bulls and bears in the coming weeks, a trendless low volatility market say 1490-1510. Then we will see some final push in to 1520-1530 where the situation will need to be reevaluated but for now I am comfortable shorting equities there and being long short individual equity names as well as long short equity index vs commodities on the way up there. Most likely we will have a trendless market up there for some months.
What is more interesting and potentially trending is the commodity space. Gold could be breaking down hard and to a lesser degree copper. I believe there are two drivers behind this move now, 1) the beginning of the first period end of money printing (i.e. there will be more later on). 2) the great asset class rotation from interest bearing assets to income generating assets.
November 28, 2012
Weekly update 11/28
Looking to increase longs in to this weakness but it is not without hedging. There are many weak equity names out there and looking at the bigger macro picture, there are industrial metals and energy that are relatively weak and continue to be good hedges (something I have stressed for some months now) against equity longs. Precious metals continue to be good longs as well.
This could be the last upmove in equities before we get a bigger correction going (both in time and space). Emerging markets are horribly weak and also some developed markets like export oriented Sweden which also has not had its housing market crash yet (but it will), compared with for example the S&P. So there are many ways to setup long/short portfolios in this environment.
In many markets it is obvious that central bank actions are boosting financials relative to industrial. This I take as a sign as the final push higher, when fundamentals (layoffs) catch up, it will hurt everyone. But it is more - both in fundamental analys and technical analysis - a projection about generally "dead" markets than something that will crash like post 2000 and 2008.
November 21, 2012
Weekly update 11/21
Election squeeze, and over done sell off and now right back at 1390. A lot of technical damage was done the last weeks. If the SPX looks bad, commodities like oil and copper and some tech names are outright horrible. The only factor that is worse than these charts is sentiment. Sentiment is so bearish it only takes a minor piece of good news, like a half hearted fiscal cliff solution, to push this market to around year highs.
I am looking for a brief decline post thanksgiving to flush out some of the swing bulls and then a continued bearish sentiment driven squeeze to around new highs. This position could easily be hedged by short positions in some commodities as well as a long position in the dollar. It looks like emerging markets will lead the way to the downside after this final squeeze. Right now, let the option premium decay in to the low volatility holiday season.
October 31, 2012
Weekly update 10/31
After a week of wound licking I am ready for a new position in the market. With SPX at 1405 and projected range of 1400-1500 in to the new year, the area around 1400, especially given elevated vix, is excellent for selling atm puts. I am prepared for perhaps one final shakeout so I take half the position now and half on an event related move higher or on a shakeout between 1390 and 1400.
The vix is at 18.6 vs a realized SPX 20-day volatility ~10, which strengthens the case of selling option premium.
October 4, 2012
Housing bubbles, sweden and USA
From Swedish business newspaper Dagens Industri http://www.di.se/artiklar/2012/10/4/svenskar-tror-pa-hogre-bopriser/
"Swedes believe in higher house prices"
I have updated the chart that I have produced for a couple of years now, an overlay of real swedish house prices on top of the famous chart from professor Schiller of american real house prices.
What is striking is how swedish house prices have followed american house prices with some added volatility. It is also striking that while american house prices seem to have bottomed (not very well illustrated by this chart since for american prices, it ends 2011), the economy seems to find new traction even in the industrial sector, where wages are much more competitive than in Sweden, where companies also now have the artificially highly valued swedish krona to handle.
The swedish krona is a major short for me at these levels. The previous years success of the swedish economy is based on a housing bubble, nothing else, as illustrated in this chart. Government debt levels will rise quickly as the wellfare system kicks in to compensate newly laid off people as well as eventually bailing out home owners/banks.
The swedish price series is based on the "Residential houses for permanent living" or "Småhus för permanentboende" price series deflated by the main consumer price index.
Husbubbla, Fastighetsbubbla, Sverige.
October 3, 2012
S&P 500 Earnings and revenue growth
Important big picture view of the historical earnings and revenue growth of S&P 500. Please tell me what could drive any future above average growth. It is all about QE and, at best, a very stable low growth environment.
September 22, 2012
S&P 500 priced in gold and oil.
Is the stock market going up? Or is it just other things than the consumer price index getting more expensive?
Short SPX, Long Gold, one of my major trades for 2012 now that the next leg in central bank activism has been initiated and equities generally have squeezed away most of the risk premia.
![]() |
| Short SPX, Long Gold. |
![]() |
| Short SPX, Long WTI
Ritholtz posted a relating chart with gold compared to the consumer price index. That is a flawed measure in my opinion since the consumer price index will never reflect inflation at this stage in the printing cycle.
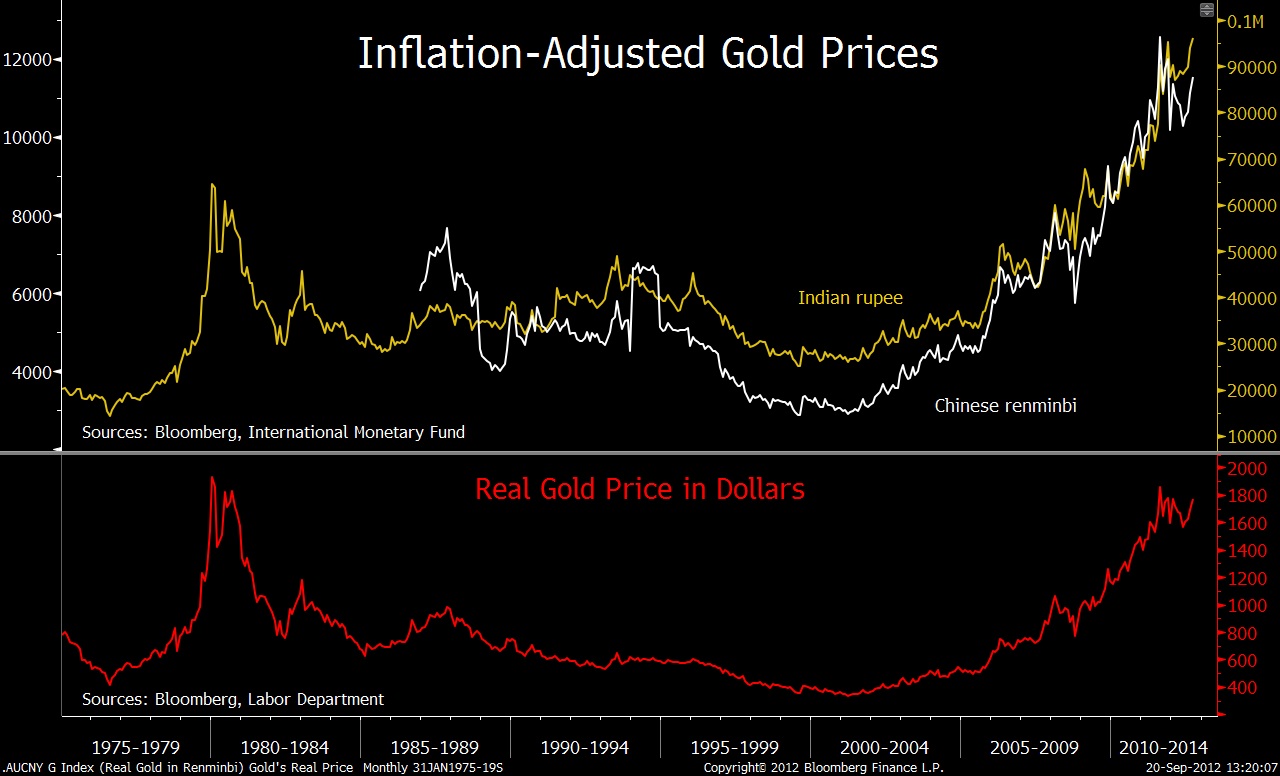
http://www.ritholtz.com/blog/2012/09/is-gold-cheap-or-expensive-look-to-china-india/
Swedish business magazine Affärsvärlden in http://www.affarsvarlden.se/tidningen/article3541208.ece relates gold with the tulip bubble. In other words, we are quite far from the contra-magazine-indicators that usually follows with a true bubble. |
Subscribe to:
Posts (Atom)


.png)
